
Global Liquidity and Bitcoin: The Simplest Predictor of Bitcoin's Price Nobody Talks About
Summary
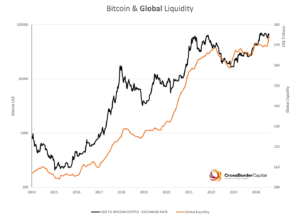
Global liquidity, the total amount of money flowing through the world’s financial system, has tracked Bitcoin’s price cycles with remarkable consistency, making it one of the most straightforward macroeconomic indicators for understanding where Bitcoin might be heading next.
Published: March 2026 | Reading time: ~4 minutes
Most frameworks for predicting Bitcoin’s price require hours of study. Complex on-chain models, technical chart patterns, halving cycle analysis, the learning curve is steep and the signal often murky.
One indicator cuts through almost all of it, moves in clear directions, and fits into a single sentence. When the world’s money supply expands, Bitcoin tends to climb. When it contracts, Bitcoin tends to fall. Everything else is elaboration.
What Is Global Liquidity?
Global liquidity describes the total volume of money and credit circulating through the world’s financial system at any point in time. It is not a single published figure but a composite reading drawn from central bank balance sheets, broad money supply measures, credit availability, and cross-border capital flows across the major economies.
The most widely used proxy is global M2, which aggregates the broad money supply across the United States, the Eurozone, China, Japan, and the United Kingdom. Quantitative easing, interest rate cuts, and balance sheet expansion push M2 higher. Rate hikes, tightening programmes, and liquidity withdrawal pull it lower.
The number moves slowly relative to crypto markets, but its direction exercises a disproportionate influence over where risk capital eventually ends up.
Why Liquidity Drives Bitcoin
The logic is straightforward once you approach it from first principles.
Bitcoin is a risk asset with no earnings, no yield, and no cash flow to anchor a valuation. Its price reflects how much capital is prepared to flow toward it relative to every other available option.
When money is abundant and cheap, investors stretch for higher returns, rotating progressively from cash into equities, commodities, and eventually into higher-risk assets like Bitcoin. Liquidity lifts the entire risk spectrum.
When money becomes scarce and expensive, the process reverses. Investors reduce exposure to volatility first, retreating toward safer assets. Bitcoin, occupying the furthest point on the risk spectrum, absorbs that pressure most sharply.
The result is a consistent pattern: Bitcoin’s major bull runs have overlapped with liquidity expansions, and its deepest drawdowns have tracked liquidity contractions.
The 2020 to 2022 Cycle
The relationship played out in near-textbook fashion across the most recent complete cycle.
March 2020 brought an extraordinary global monetary response to the pandemic. The Federal Reserve cut rates to zero and launched an enormous quantitative easing programme. Central banks across the world followed with their own stimulus. Global M2 expanded at a rate not seen in living memory.
Bitcoin, which had collapsed to roughly $4,000 during the March panic, subsequently climbed to nearly $70,000 by November 2021, one of the most rapid appreciations any asset had ever produced. Global liquidity and Bitcoin’s price moved in near lockstep throughout.
The reversal arrived in 2022. Facing inflation it had underestimated, the Federal Reserve executed its most aggressive tightening cycle in four decades. Global M2 contracted. Bitcoin shed more than 75% of its peak value. The broader crypto market followed it down.
The timing was not accidental.
The Lag Effect
Bitcoin does not react to liquidity changes the moment they occur. Research attributed to macro analyst Lyn Alden and liquidity specialist Michael Howell points to a typical delay of twelve to sixteen weeks between a directional shift in global M2 and a corresponding move in Bitcoin’s price.
The lag reflects how monetary policy filters through the financial system, from central bank decisions into lending conditions, from lending into investor behaviour, and from investor behaviour into speculative assets. The signal is reliable but arrives with a delay that is itself useful information for anyone monitoring it closely.
What the Model Is Saying Now
By late 2023 and through 2024, the aggressive tightening cycle that characterised 2022 began to ease. Inflation retreated toward target levels. China deployed fresh stimulus. The Federal Reserve signalled an openness to rate reductions. Global M2 resumed its expansion.
Bitcoin’s recovery through 2024 and its new highs tracked this shift closely, consistent with the pattern the model predicts. As of 2026, the policy directions of the Federal Reserve, the European Central Bank, and the People’s Bank of China remain the most important macro variables for interpreting Bitcoin’s medium-term trajectory.
The Limitations
Global liquidity is a directional guide, not a precision instrument. Bitcoin regularly deviates from the liquidity signal in the short term, responding to exchange collapses, regulatory decisions, ETF approvals, or halving dynamics that operate independently of monetary conditions.
The model tells you whether the environment favours Bitcoin or works against it. It does not tell you when the price will move or by how much. Past correlations, however strong, carry no guarantee of future repetition as Bitcoin’s market structure continues to mature.
The Bigger Picture
Most investors chasing a Bitcoin framework disappear into on-chain complexity and technical analysis. Global liquidity offers something more durable: a simple, logically grounded explanation for why Bitcoin behaves the way it does across full market cycles.
Money seeks returns when it is plentiful. It retreats to safety when it is not. Bitcoin sits precisely where that dynamic lands most forcefully. You do not need an elaborate model to see it. You just need to watch which way the tide is moving.
Disclaimer
This article is for informational purposes only and does not constitute financial or investment advice. Always do your own research before making any investment decisions
Frequently Asked Questions
1. Where can I track global M2 and liquidity data?
TradingView lets you build a global M2 chart by combining major economies, and Michael Howell at CrossBorder Capital publishes regular dedicated liquidity research.
2. How closely does Bitcoin track global liquidity historically?
Studies suggest a correlation above 0.9 over multi-year periods, one of the strongest macro relationships observed across any asset in crypto.
3. Does the global liquidity model work for altcoins too?
Yes, altcoins are typically even more sensitive to liquidity shifts, amplifying both gains during expansions and losses during contractions relative to Bitcoin.
4. What is the typical lag between a liquidity change and Bitcoin's response?
Roughly twelve to sixteen weeks, reflecting how long monetary policy takes to filter through lending, credit markets, and investor behaviour before reaching speculative assets.
5. Is global liquidity more reliable than the Bitcoin halving model?
Many analysts argue yes, as it directly explains capital flows, while halving supply mechanics are increasingly anticipated and priced in well ahead of the event itself.